
Energy Lollipop
Extension Actions
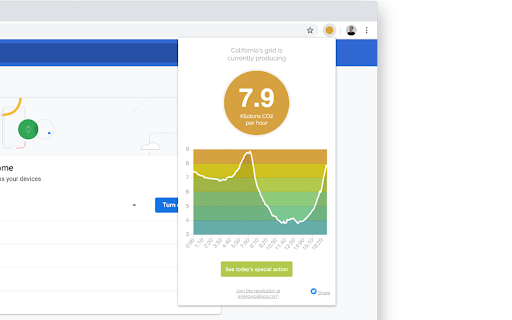
An extension that displays the current emissions of California's grid.
Have you ever thought about how much carbon dioxide the California electricity grid is releasing at any moment?
Energy Lollipop is an extension that displays the current emissions of California's grid. Simply click the colored lollipop circle in your browser to see the metric kilotons of CO2 / hr updated every 5 minutes. Check it any time of the day!
The Energy Lollipop will show you what times of the day your power is the cleanest and what times of the day (and year) it is the most polluting. Electricity is the cleanest during the middle of the day when California’s solar panels are active. It’s the dirtiest in the evening at dinner time and on hot summer days (from AC use) when the grid relies heavily on gas power stations.
Data is drawn from the California Independent Systems Operator.
We hope this data will inspire you to join our mission to get the electricity grid to zero emissions - through saving energy and influencing your local community.
Let's get to it zero!
Latest reviews
- Bruce Karney
- Simple, accurate, useful. Avoid using electricity when emissions are high (late afternoon and early evening) and use it when emissions are low (mid-day, especially on weekends).
- Bruce Karney
- Simple, accurate, useful. Avoid using electricity when emissions are high (late afternoon and early evening) and use it when emissions are low (mid-day, especially on weekends).
- Selim Benayat
- Simple. Elegant. Understandable. All I need to make a change!
- Selim Benayat
- Simple. Elegant. Understandable. All I need to make a change!
- Brad Clarke
- I love how I can see the power generation changes during the day, and get super excited when it goes down - great tool!
- Brad Clarke
- I love how I can see the power generation changes during the day, and get super excited when it goes down - great tool!
- Ian Fletcher
- This is a really great app. It's interesting to see what our power grid is doing all day, and it really helped motivate me to make a bigger effort to save energy! Definitely recommended.
- Ian Fletcher
- This is a really great app. It's interesting to see what our power grid is doing all day, and it really helped motivate me to make a bigger effort to save energy! Definitely recommended.
- Katie Patrick
- I have never been more motivated to save power since installing this. Even though it's for the whole state as an aggregate, seeing it go into the red every night has gotten me being much more careful with power than I was before. It's real-time, so it's so interesting to see it change so much all the time.