
Tag Manager Server Debug Console
Extension Actions
- Live on Store
Extension for TMS debug mode
This extension only works in combination with the Tag Manager Server (v0.4.0) Tracking setup. It is used to analyze all server requests to and from the TMS.
With the TMS Debug Console you can view all dataLayer Push events and executed server tags.
TMS Debug Console (chrome extension)
1. Download this Chrome extension from chrome web store:
2. Set the debugAuth code in your config.php: $aConfig['default']['debugAuth'] = '...';
3. Navigate to your Page with TMS implementation
4. Open the TMS Debug Console Settings with a click on the extension icon
- Set the same authCode as before
- Activate Debug Console and debugMode if needed
- Test new container from your server
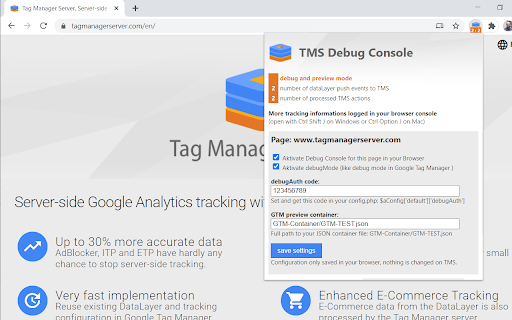
Debug Console settings & information
The coloured background of the numbers shows the status of the current server-side tracking:
- grey: inactive Debug Console
- green: Browser console logs activated
- orange: activated debug mode
- purple: container preview
- red: invalid debugAuth code or TMS error
The two numbers show:
- Tag Manager Server Input shows the submitted data from the browser to the TMS API.
- Tag Manager Server Action shows the server request of the TMS via the measurement protocol to Google Analytics
Browser console output
Once you have activated the Debug Console with the appropriate debugAuth code, the browser console will display the most important tracking information.
Like this extension the whole server-side tracking solution is still in beta stage. You can find more information on our website.
Latest reviews
- Sascha Roth
- Funktioniert einwandfrei!