
JavaScript Profiler
Extension Actions
CRX ID
cjffkpkljodmdajjbkcjeflmmhnackij
Description from extension meta
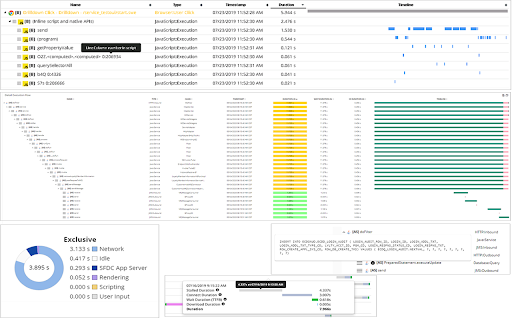
JavaScript Code Execution Analysis, real-time, 24x7. Provided by Germain UX
Image from store
Description from store
Features:
- Analyze JavaScript execution, in real-time, 24x7
- Correlate JavaScript calls with Application Back-end Code (e.g Java, C#, Python, Php, etc), Database SQL, Integration, etc
- All the above metrics can viewed on Germain UX dashboard (onPremise or cloud instance: https://germainux.com/cloud-login)
- Automate Task (Alert, Data Update, Service Restart, Reporting, etc)
- For all your users or a targeted user
Benefits:
- Identify whether a User Experience issue is caused by slow or failing JavaScript, browser, network, infrastructure, application, database, and deep dive within the code (JS or backend), in real-time, 24x7
Latest reviews
- Utopia Tang
- Not useable without account.
- Utopia Tang
- Not useable without account.
- Kiran Lakhotia
- Great tool to debug performance issues!
- Kiran Lakhotia
- Great tool to debug performance issues!
- Dave Scott
- Provides great additional insight into browser performance!
- Dave Scott
- Provides great additional insight into browser performance!
- Bartek K
- I was able to get complete JS execution insights with this extension. Helped me in root-cause analysis for my end users transaction. Super happy with this extension and germain APM.
- Bartek K
- I was able to get complete JS execution insights with this extension. Helped me in root-cause analysis for my end users transaction. Super happy with this extension and germain APM.
- Justin Coombs
- Made it easy to separate script performance issues from users internet issues
- Justin Coombs
- Made it easy to separate script performance issues from users internet issues
- Benjamin Damer
- Great way to get real-time insight into your page performance!
- Benjamin Damer
- Great way to get real-time insight into your page performance!