
TradingLever - Stock Analysis
Extension Delisted
This extension is no longer available in the official store. Delisted on 2025-09-17.
Extension Actions
- Unpublished Long Ago
Analyze your stocks portfolio or stocks list in the current website/article.
TradingLever is a simple stock market analysis and hunting platform.
Brief summary:
- Load tickers list from any website and compare them by any metric
- Easily customize and add plots and more financial metrics for quicker insights
- Analyze and compare by value, growth, dividend and more
- Build full dashboard for the way you want to analyze and compare - DIY
- Drag and drop customization allows arranging the components in any way you like so you can quickly draw conclusions and review your list
- Add more companies to the list to easily compare against your own list from the website
- Group and aggregate equities by industry, sector and more - to see aggregated metrics such as industry growth, sector P/E, Mid-Cap Dividend Yield, etc, and draw conclusions as to whether your company is overvalued/undervalued compared to its peers in the group
- Intended for anyone, from novice to professional investors
- Updated to the close price of the last trading day
- 100% free as a service to the investment community
TradingLever conveniently allows you to compare your list of stocks by price-earnings ratio, revenue, dividends or any other financial metric! Through this extension, you may analyze your portfolio or any tickers in the current website/article (e.g. yahoo finance article).
Simply click the app extension icon to load your list from the current website. This feature works on any website!
Use Cases:
Load a stocks list from any news article you are reading and, from there, you can compare them.
You may also load a list of “trending” symbols or a list from your personal portfolio (Interactive Broker, RobinHood, TD Ameritrade, etc.) for analysis or comparison. Trading Lever is a flexible extension, and you may load in any custom list you are tracking!
How It Works:
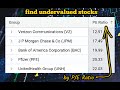
When loading the extension, the list on the left pane is filled with your list of symbols. Similarly, on the second column, we see a financial metric. This is set by default as "1-Week Price Change %". It is possible to sort the list in this column by clicking on the column name. Or, you can change this column to any other property using the listbox above.
Properties include, but are not limited to, EPS, EBIT, price/revenue growth rates, and financial ratios. It is also possible to add more columns by clicking on the "Columns" tab on the right. From here, you can either click the checkbox or drag columns into the table.
Value vs Growth vs Dividend
As an investor, you may be interested in inherent company value, in growth, or in dividends.
The specific type of analysis may depend on your list, and so you may choose either P/E Ratio (for value), Earnings/Sales Growth (for growth), and Dividend Yield (for dividend).
After loading your list, you may change the financial metric by clicking the listbox above your list and select the right metric for your analysis.
Stocks Dashboard:
When clicking a symbol/name in the left pane, you will find that the whole dashboard will be refreshed to show the income/profit, price chart, and financial metrics for the selected item. Also, a comparison of all list items by market cap will be shown in a barchart at the bottom.
Custom Plots:
The default view can easily be customized by clicking the "Expand" icon below the list and by adding more plots. It is possible to add two types of plots:
1. Time-Series Plots: These show the property as a function of time. E.g. show gross profit, operating income, or any other metric shown in the financial statement as a function of time.
2. Breakdown Plots: These indicate a comparison breakdown chart of all entries in the list. You may select an inherent property such as PE, 1-year price change, dividend yield, or any of the other fields. This is similar to the "Market Cap" breakdown which is shown by default at the bottom.
Drag-and-Drop Customization:
All elements on the Dashboard can be easily dragged and resized to make the Dashboard easier to use by highlighting the specific financial properties that the user is interested in.
Adding Companies to the List:
It is possible to use the Search Box at the top of the page to add more companies for comparison and analysis. Simply type in a symbol or a company name and click the checkbox to get started.
Grouping and Aggregating Items:
It is possible to group various companies together and view their metrics together as an aggregate. E.g. you could potentially compare Energy companies to Finance companies or even Technology companies. To accomplish this, drag the relevant column from the Columns tab on the right into the Aggregation space just above the list.
For example, you may drag the Market Cap column into the aggregation space to see a breakdown of the selected companies by Market Cap. It is also possible to drag several columns to see several levels of aggregation. You may also choose to view certain company metrics such as price changes, revenues, EPS and more on an aggregate level. This way, you can compare the financial metric of the company to the metric on the aggregate level of the group.
As an example, this may help you see if an energy or technology stock's PE ratio is high or low compared to its group. You may also use this feature to compare the price/sales ratio of a tech symbol to the average price/sales ratio of the whole technology sector. In addition, it is possible to refine the "group" definition to compare only to specific market caps, financial ratio groups, IPO years, etc. These possibilities and features make our comparison more accurate and trustworthy. This method is also more accurate than comparing the price change to the change of the S&P index, or to the Dow Jones Industrial Average as these are both very general indices and less specific to a specific industry/sector/market cap group.
Intended Audience:
This app is customized and geared towards anyone interested in investing in the NYSE or Nasdaq. It is intended for professional investors ,financial analysts, investment managers, as well as beginners still in the learning process who may be in the steps of researching the U.S. Equities Markets. It was our mission to simplify the user workflow of TradingLever enough so that anyone can use it! We are definitely open to any suggestions for improvement. For questions or comments, please contact us at [email protected]
Data Updates:
Data is updated daily for the accurate close price and other financials including financial ratios as well as all data from the financial statements up to the previous trading day. The daily (and not minute or second-level) data may make this platform less suitable for Day-Trading or Real-Time trading. However, even for day traders, the insights and methods of analysis may still be prove to be invaluable.
App Permissions:
TradingLever will read the list from the current website you're visiting once you click the app icon in the Toolbar. No other information will be read or changed in the website, and the list will be sent to our servers solely for the purpose of retrieving the financial data for the companies in the list that was fetched from the website.
Cost:
This app is provided 100% free of charge as a demonstration of the Leverium Financial Analytics Platform. Leverium can be used for other purposes that are not free, but we are happy to announce that we have decided to provide the TradingLever extension for free to the investing community.
Disclaimer:
The data provided in TradingLever is not investment advice, and the creators of TradingLever take no responsibility for the accuracy of the data or any actions that may be done as a result of viewing this data. This includes, but is not limited to, investment decisions, loss of money, and any other damage that may come as a result of using TradingLever. If there are any problems with the data provided, we would appreciate your feedback at [email protected] so we can quickly correct the situation.