
CRX id
kfjhkjmhmhbaafplpdocolmcedpaggjm
kfjhkjmhmhbaafplpdocolmcedpaggjm
Description from extension meta
Transform tabular data from any web page to a data source, explore it, visualize and share. Showcases Datoris analytics platform.
Image from store
Description from store
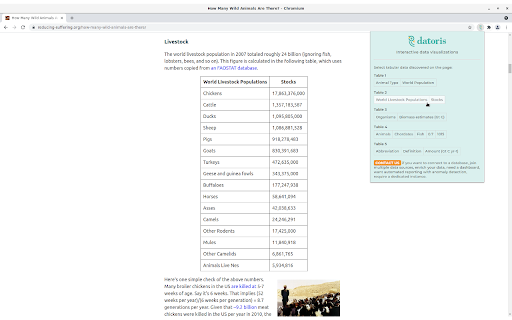
Datoris Chrome extension integrates web page scraping with data analytics.
It enables you to explore and visualize tabular data you stumble on at any web site.
The extension discovers data in your currently active tab, and gives you a list of tables to choose from.
Once you select one, it scrapes the data, and transforms it to a data source, which you can interactively explore.
You pick your chart columns, aggregate them, filter, sort and format.
There are nine types of visualizations available in the current version.
Your resulting report can be exported as a CSV, Excel, image or PDF file, to be reused, or shared with others.
In the background, the extension uses Datoris analytics platform, which has many more features, like reading from different data storage platforms, joining multiple data sources, data enrichment, anomaly detection, chart embedding, composing multiple charts on a dashboard, whitelabeling and customization.
Learn more at https://datoris.com
Version 1.0.2 includes bug fixes and line chart displaying detected anomalies.