Description from extension meta
Data visualization for GraphQL state
Image from store

Description from store
This Chrome extension will add a panel named "GraphQL state" to your devtools. When you use the framework "https://github.com/babyfish-ct/graphql-state";, it can help you debug.
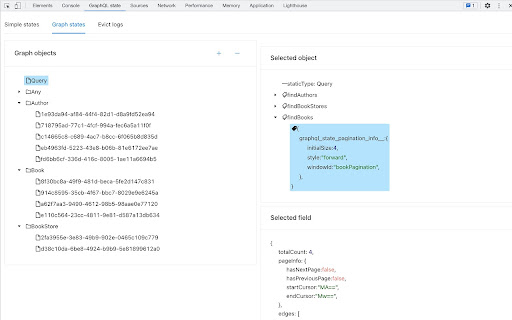
In the "GraphQL state" panel, you will see three tab pages: "Simple states", "Graph states" and "Evict Logs".
1. Simple states
The framework supports simple state management similar to "recoil", this tab page can visualize all simple states for you.
2. Graph states
The framework supports graph state management similar to "Apollo Client" and "Relay", its built-in normalized-cache is used to manage all data and relationships. This tab page can visualize this normalized-cache for you.
3. Evict Logs
This is the core value of the framework.
The essence of UI state is that one main mutation causes N extra mutations, the more complex the UI, the larger the N.
The framework allows developer only focus on main mutation, all the extra mutations will be executed automatically.
Compare with Apollo Client and Relay, after mutation, you neither need to update other affected data in the cache, nor need to determine which queries will be affected and need to be refetched.
When the framework is automatically performing extra mutations, it can choose to modify the cache directly, or it may choose to evict affected data from cache (this will cause related queries to be refetched automatically).
Obviously, the first choice is better than the second choice. This tab page lists the history of the second choice made by the framework, and tells the developer the following information.
i. Why did the framework make the second choice?
ii. Is it possible for developers to intervene in optimization and let framework make the first choice?
iii. If so, what should developers do?
