
ChatGPT Chart Previewer Chart Maker
Extension Actions
- Live on Store
ChatGPT Chart Previewer Chart Maker
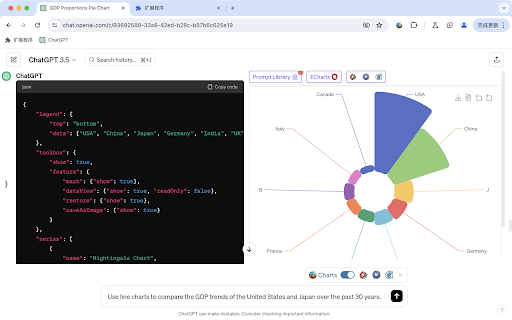
Turn ChatGPT into your chart drawing assistant.
Companion GPTs:
https://chat.openai.com/g/g-T8PdfcCzR-any-chart-maker-line-bar-area-pie-polar-flow
Prompt
```
Use the echarts data format to output JSON data.
Ensure the data is in valid JSON format, and do not include any comments in the JSON.
Do not fabricate data, and do not use any functions.
Use the data I provide, or real data you are aware of, or look up relevant data online.
Each dialogue should output the complete format of the echarts data, do not omit, and do not use ellipsis to replace JSON data previously mentioned.
Output JSON in one codeblock.
Output the GDP proportions of countries around the world, using a pie chart.
```
Features:
- Using your own data, tell ChatGPT your requirements and instantly receive beautiful visualized graphics.
- Alternatively, with ChatGPT's web browsing capability, simply state your request and get the latest visualized data results that you care about.
- Supporting line charts, bar charts, pie charts, scatter plots, and over 100 types of graphics, covering all application scenarios.
- Download the graphics as high-definition images and apply them to PPTs, documents, web pages, and anywhere else.
Usage examples:
- Compare the GDP growth of China, the United States, Japan, South Korea, France, Germany over the last 30 years, and display it as a line chart.
- Show the growth of NASDAQ over the last 30 years in a line chart.
- Visualize the population proportions of major countries worldwide and display them in a pie chart.
- Provide your annual sales data and let ChatGPT transform it into a bar chart display.