
Claude Usage Monitor
Extension Actions
Monitor Claude usage limits with visual charts and periodic updates
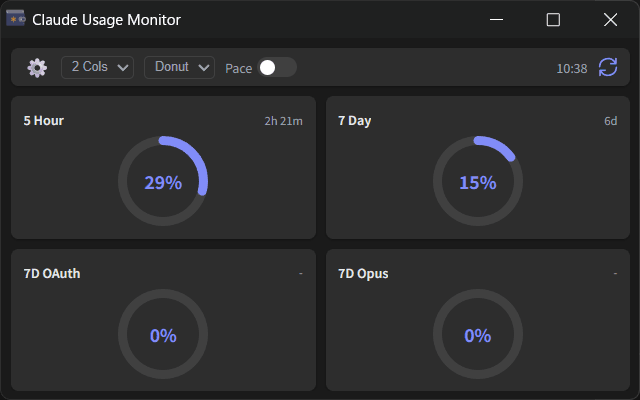
Claude Usage Monitor displays your Claude usage statistics in a simple dashboard.
What it does:
- Shows your usage for different time periods (5-hour, 7-day limits)
- Displays data as donut charts or progress bars
- Updates automatically every 5 minutes
- Lets you adjust the layout (1, 2, or 4 columns)
Pace indicator:
When enabled, shows a purple line indicating the expected usage based on time elapsed.
This helps you see if you're using credits faster or slower than average.
Setup:
Enter your Organization ID in the settings.
The extension uses your existing browser session to fetch usage data.
To find your Organization ID:
1. Log into Claude.ai
2. Go to Settings → Account
3. Copy the Organization ID
Privacy:
All data is stored locally on your device.
Nothing is sent to external servers.
Note:
This is an unofficial tool.
Use it in accordance with Anthropic's Terms of Service.
Changelog:
https://github.com/oov/claude-usage-monitor/blob/main/CHANGELOG.md
Source Code: