Request Time-Lapse
Extension Actions
DevTools panel that records, groups, and replays network request history for API regression debugging.
Request Time-Lapse is an advanced Chrome DevTools extension designed specifically for developers, QA engineers, and API specialists who need a powerful, comprehensive tool for capturing, analyzing, and debugging network request histories. Unlike standard browser network panels, this extension focuses on developer productivity by automatically recording every HTTP and HTTPS request passing through your web applications, enabling you to monitor, compare, and visualize network behavior with precision and ease. Whether you are performing API regression testing, performance analysis, integration debugging, or preparing detailed reports for team collaboration, Request Time-Lapse delivers a modern interface equipped with deep filtering, grouping, snapshot comparison, and flexible export capabilities to simplify your workflow and enhance your API debugging process.
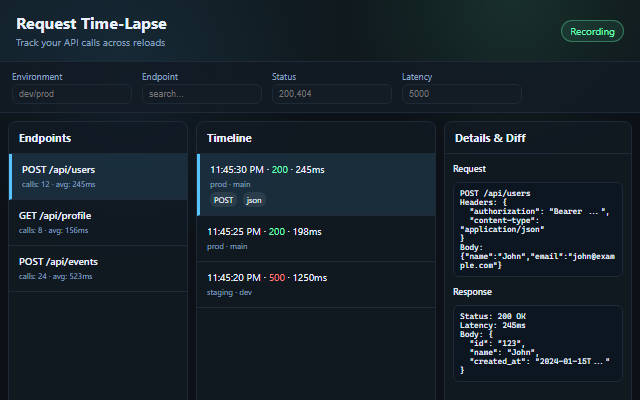
Once installed and activated, Request Time-Lapse integrates seamlessly into Chrome DevTools as a dedicated panel that begins capturing network requests immediately without any additional setup. Requests are intelligently grouped by endpoint and HTTP method and can be further categorized by environment such as production, staging, or feature branches. Users can examine detailed data for each request, including latency, HTTP status, headers, and full request and response bodies. A storage quota monitor tracks your local data usage up to 50MB and warns when capacity is nearing, ensuring smooth operation without unexpected data loss.
One of the core strengths of Request Time-Lapse is its advanced filtering system. You can quickly isolate requests using criteria like HTTP status codes (e.g., 200, 404, 500), latency ranges, specific keywords within response content, or endpoint searches. Filters are combinable, allowing precise narrowing to find problematic or interesting API calls efficiently. Additionally, the extension’s “Compare Mode” is a powerful feature for regression debugging—it enables side-by-side comparison of two snapshots of requests, highlighting differences in response bodies, response headers, latency, and even underlying response schemas. This visual diff capability provides clear insights into API changes across versions, environments, or deployment stages, facilitating immediate detection of regressions and unexpected behavior.
For comprehensive analysis and team sharing, Request Time-Lapse offers bulk export options in multiple formats. Export your recorded request data as full-fidelity JSON files for programmatic use, CSV files for spreadsheet analysis in Excel or Google Sheets, or visually rich HTML reports ideal for sharing with non-technical stakeholders and documenting test outcomes. The extension also supports a suite of keyboard shortcuts designed to accelerate common workflows such as focusing search fields, toggling themes, enabling compare mode, navigating requests, and launching export dialogs.
Usability is enhanced by a modern interface with a choice of dark and light themes that persist user preference, making long debugging or testing sessions more comfortable across varied lighting conditions. The UI is optimized to handle large datasets smoothly, displaying requests grouped by environment or endpoint for clarity. Data management tools allow easy clearing of old records with reminders to export first, maintaining efficient storage use.
Request Time-Lapse fits perfectly into practical workflows including:
- API Regression Testing: Compare requests before and after deployment to identify breaking changes immediately.
- Performance Monitoring: Diagnose high-latency or failing endpoints during development and testing.
- Integration Debugging: Track third-party API requests and verify their consistent behavior.
- Team Collaboration: Produce and share clear reports with teammates and stakeholders.
- Quality Assurance: Create snapshots at different stages of testing for precise verification of API behavior.
Getting started is simple: open Chrome DevTools (press F12), select the “Request Time-Lapse” tab, and start using your web application as usual. Every network request is captured automatically. Use the intuitive filters and search tools to locate specific requests, compare snapshots visually, and export your data as needed. The extension includes comprehensive documentation and a quick-start guide to accelerate onboarding, along with troubleshooting resources and community support via GitHub.
Privacy is a paramount concern: all captured data resides locally within your browser. The extension does not transmit any data externally, nor does it track user activity or collect analytics. This guarantees that sensitive API data and debugging information remain fully under your control.
Request Time-Lapse requires Chrome version 90 or higher and standard DevTools access permissions for reading network requests. It is a perfect companion for full-stack developers, frontend engineers, QA testers, API developers, performance engineers, integration specialists, and DevOps professionals seeking a reliable, efficient solution for API regression debugging and network request analysis.
Key Features:
- Automatic Recording: Captures all HTTP/HTTPS requests encountered by your web app and stores them locally for analysis.
- Powerful Filtering: Filter requests by status code, latency, environment, endpoint, and response content with combinable criteria for precision.
- Snapshot Comparison (Diff Mode): Side-by-side visual diff of two request snapshots highlighting differences in headers, latency, response bodies, and schemas.
- Multi-Format Export: Export recorded data as JSON for full fidelity, CSV for spreadsheet tools, or HTML reports for easy sharing and documentation.
- Keyboard Shortcuts: Improve efficiency with shortcuts for search, export, theme toggling, compare mode activation, and navigation.
- Themes and User Experience: Professional dark theme (default) and light theme option with persistent preference saving, optimized for long sessions.
- Storage Monitoring: Visual indicator tracks data quota usage, warns on nearing limits, and offers safe clearing options with export reminders.
- No Setup Required: Instantly starts recording when DevTools are open, with intuitive grouping and real-time display of request data.
How It Works:
1. Install Request Time-Lapse and open Edge DevTools o (F12 or right-click → Inspect Element).
2. Select the “Request Time-Lapse” tab—data recording begins automatically with no configuration needed.
3. Use your application normally; the extension captures and groups every network request by endpoint and environment.
4. Apply filters or search to narrow down to specific requests by status, latency, response content, or endpoint.
5. Enable Compare Mode (Ctrl/Cmd + Shift + C) to select two snapshots and visually inspect the highlighted differences in responses and metadata.
6. Export your network request history in JSON, CSV, or HTML formats using the export menu or shortcut (Ctrl/Cmd + E).
7. Manage stored data with the storage usage monitor, clearing old records safely after exporting backups.
Privacy: - No personal data collected. All request history is stored locally in your browser and never sent remotely. No tracking or analytics are involved.