
Network Console
Extension Actions
A powerful network request monitoring and debugging tool, similar to Edge browser's network console, supporting request editing, resending and response analysis
Network Console is a powerful network request monitoring and debugging tool designed specifically for developers. It provides richer functionality than native browser developer tools, making API debugging and network analysis more efficient and convenient.
🔧 Core Features:
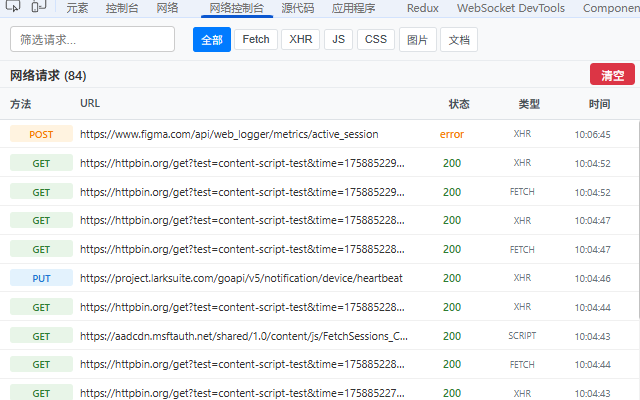
• Real-time Network Monitoring - Automatically captures all types of network requests (XHR, Fetch, resource loading, etc.)
• Request Details Viewing - Complete display of request headers, response headers, request body, and response content
• Request Editing & Resending - Support for modifying URL, method, headers, and request body before resending
• Request Response Interception - Blocks one or more APIs and modifies their response data
• Batch Request Testing - Configurable request count for stress testing and stability verification
• Response Result Analysis - Dedicated panel with formatted JSON responses and syntax highlighting
• Smart Filtering - Quick filtering by request type (JS, CSS, images, XHR, Fetch, etc.) and keywords
• Data Persistence - Local storage of request data, survives page refreshes
• One-click Copy - Support for copying request URL, headers, and response content to clipboard
🎯 Use Cases:
• API Development & Debugging - Quickly test various RESTful API request methods
• Frontend Development Troubleshooting - Monitor AJAX requests and quickly locate network issues
• Network Performance Analysis - Analyze request response times and identify performance bottlenecks
• Interface Stability Testing - Batch repeat requests to verify interface reliability
• CORS Issue Debugging - Clear display of CORS-related header information
💡 Interface Highlights:
• Three-tab Design - Request details, editor, and response results displayed side by side without scrolling
• Responsive Layout - Adjustable split-screen display adapting to different screen sizes
• Dark/Light Theme - Automatically adapts to system theme settings
• Intuitive Status Indicators - Request status, response codes, and timing at a glance
🛡️ Privacy & Security:
• Fully Local - All data stored locally only, never uploaded to any server
• Minimum Permission Principle - Only requests necessary browser permissions
• Complete User Control - Data can be cleared anytime, manual monitoring toggle supported
Perfect for all developers who need network request debugging, supporting Edge browser version 88+.