Web Time Analytics
Extension Delisted
This extension is no longer available in the official store. Delisted on 2025-09-17.
Extension Actions
- Minor Policy Violation
- Removed Long Ago
- No Privacy Policy
Helps with data visualization based on time spent on specific web pages.

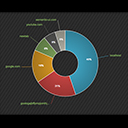
Web Time Analytics aims at providing a useful presentation on how you spent your time on the web. There are 3 forms of presentation used.
• Pie Chart (Percentage)
• Table (Breakdown on percentages)
• Line chart (Activated from Table)
How it works:
Every time you switch tabs or open up a new tab it starts counting until you switch to a new tab at which point it saves the time you spent at the previous tab and starts the process all over again.
How data is displayed:
Only the top 6 websites you visited for the day are visible. The line chart requires at least one day of web usage to display trends on web usage. The line graph only displays the past 6 days at a maximum.