
Xdebug
Extension Actions
CRX ID
nhodjblplijafdpjjfhhanfmchplpfgl
Description from extension meta
Xdebug Client
Image from store
Description from store
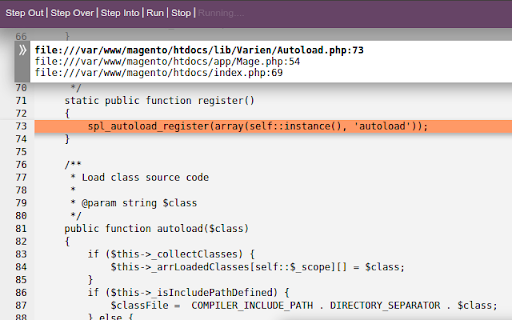
This is an xdebug client that offers:
- stepping through code,
- setting breakpoints,
- viewing stack backtrace,
- evaluating expressions.
To get started:
1. Install the app.
2. Run it and configure (in-app settings).
3. Click 'Listen' button.
4. Run your code.
Something not working? Try the in-app 'Settings/Help' button.
Still now working? Issues can be reported on the project website.
Thanks!
Latest reviews
- Tomáš Frána
- Crashes all the time. You want to run it? Crashes. You want to save settings? Crashes. Good luck to try to use it.
- Alexander Garzon
- It does the job
- Reed Zhao
- love this tool. However google is shutting down chrome app, can we get a stand-alone version?
- Marco Zirino
- Very cool. Needs a few features, such as setting breakpoints. Add a minimal source editor and you have a PHP IDE in chrome...
- Duck WebDev
- I wish I knew about this earlier!! Npp++'s debugger plugin is a bit... buggy. This is smooth and I don't have to worry about freezing up my text editor if something goes wrong. Thank you!
- Fred Campos
- Works fine and it's easy to use...