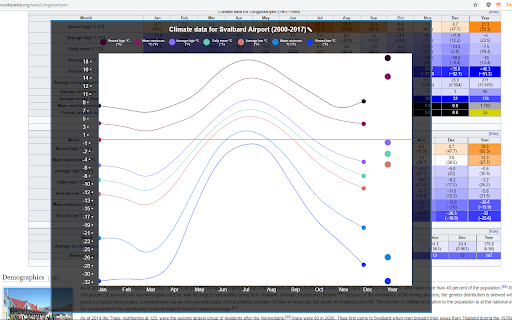
Data Graph
Extension Actions
CRX ID
pfbdpmafjjljecigflhnpmnpnlicjggg
Status
- No Privacy Policy
- Live on Store
Description from extension meta
Creates a visual plot or graph from numerical data on a web page.
Image from store

Description from store
Creates a visual plot or graph from numerical data on a web page. At this time highlighted / selected text and HTML table elements are supported. This is really just getting started with development; feel free to submit any feedback on the form found at https://desolate.netlify.com