
Node Inspector Manager (NIM)
Extension Actions
Manages DevTools with Node V8 Inspector (node --inspect) Debugging Workflow
By installing you are agreeing to:
PRIVACY POLICY - https://app.termly.io/document/privacy-policy/04164179-f943-4e87-ac8b-5afd0367dc6c
PLEASE NOTE: Installing this via the Chrome Web Store does require the sharing of your email address with me (and only me). You are given notice of this via the webstore, but it's become and remains such an issue that I feel the need to make it OVER-abundantly clear. If you take issue with sharing your email address with me (mine is [email protected] by the way) please, I implore you to clone/fork a copy yourself and change what you don't like about the code and/or use alternate solutions (none of which are as good as NiM, but call me biased). Further feel free to contact me directly and have a chat. Unlike the behemoths like Facebook, Google, Amazon that you probably (and without hesitation) share your email address with, I actually care about the concerns of the actual people who choose to use the code I wrote (~99%) and am responsible for. Here is the privacy policy that goes along with NiM https://june07.com/privacypolicy. Thank you so much.
This Chrome Extension streamlines your Node.js development cycle when using Chrome DevTools.
NiM provides extended capabilities even compared with the new chrome://inspect option. Check out what Paul Irish of the Google Chrome team wrote about NiM... https://twitter.com/june07t/status/861664828909264896.
NiM manages the Chrome DevTools window/tab life-cycle leaving you with more ability to focus on what matters... debugging your code. You no longer need to copy/paste DevTools URL's or continue opening/closing tabs/windows.
NiM automatically detects the URL that is generated when running node (locally or remotely) with --inspect option. NiM provides you with the option of automatically opening and closing Chrome DevTools in a tab or window. Just toggle the Manual/Auto setting and then start a debugging session. DevTools will open either on clicking the "Open DevTools" button or after the specified timeout period. If set to auto close, once you end your debugging session, DevTools will close automatically.
Use in 2 easy steps:
1. Install
2. Run node with --inspect flag (i.e. node --inspect hello.js)
Features:
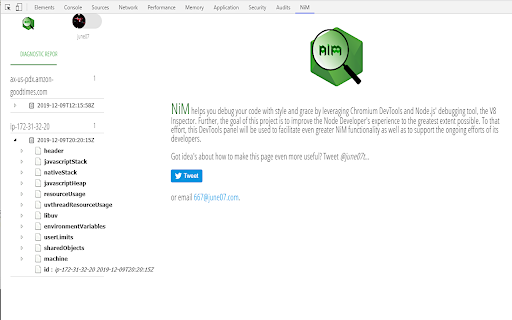
- Manage and monitor Node Diagnostics and Reports
- Manage and monitor local and remote debugging sessions
- Manual or automatic control of DevTools interface
- Open DevTools in a new tab or window
- Make DevTools focused or inactive on start
- Customize duration between v8 Inspector probes
- Auto-save settings
- Set custom DevTools bundle
- Debug node processes launched by VSCode
Note: By it's nature this extension requires permissions which
"Read and change all your data on the websites you visit"
Further to better serve and understand my user base the following permission is asked
"Know your email address"
The following URL will provide what I feel to be an informed viewpoint on the whole matter of permissions: https://palant.de/2016/07/02/why-mozilla-shouldn-t-copy-chrome-s-permission-prompt-for-extensions
No information will ever be shared with 3rd parties. Further the source is open and available on GitHub. However should you still prefer it, a version is available which does not require sharing your email address: https://june07.com/NiM11. I will maintain the code (bug fixes), however feature additions will only be made to this branch. Please feel free to reach out to me [email protected] if you have any other concerns as I am open to discussion. Should any policies change there will be notice given of such changes.
At the time of writing, the v8 --inspect option is fairly new. See https://nodejs.org/api/debugger.html#debugger_v8_inspector_integration_for_node_js for additional details on the option.d
If you enjoy using NiM please give us a 5 star rating and/or a G+1. Any and all feedback is encouraged and welcome. [email protected] Thank you in advance.
This project is open source and available at https://github.com/june07/NiM.
Latest reviews
- Luke Franklin
- Avoid this extension. It has effectively become malware and is opening unwanted tabs. The author has doubled down with hostile blog posts targeting those who criticise the poor practices used to monetise this extension.
- dschwegler
- Used to be good, but I haven't needed to use it in a long time, and the dev is now automatically opening new chrome tabs with ads, which is pretty terrible practice. I get wanting to monetize, but this is too far.
- Mykhailo Pronin
- Good tool, works perfect most of the times. However I'm using it rarely and don't want to subscribe, and current monetization is too aggressive imo. I don't like new tab with ads being open in Chrome when I watch youtube....
- Thanh Trí Nguyễn
- Perfect tool for me! Just one question, after updating chrome, the developer console stop suggesting the related objects, not sure if there is a way to fix it?
- Clifton Collins
- Wow. The easiest way to get debugging started. I Love how the folder is already selected when the debugger automatically launches with the node app browser.
- Clifton Collins
- Wow. The easiest way to get debugging started. I Love how the folder is already selected when the debugger automatically launches with the node app browser.
- A B
- Very cool extension. Prefer it over paid solutions and suggest it to co-workers :) Thanks you, Folks!
- A B
- Very cool extension. Prefer it over paid solutions and suggest it to co-workers :) Thanks you, Folks!
- Taoh Green
- Can't work without it. Amazing!
- Taoh Green
- Can't work without it. Amazing!
- Johnny George
- Hey there! Brand new user, but I just wanted to say thank you for this! I've been searching for months for a solution to my chrome debugger not working anymore and stumbled upon a github thread where someone posted this extension as a possible fix, and lo and behold it is! Again, thank you so much for putting this out here!
- Prakash Gp
- Is there any way i can debug network requests ??
- Prakash Gp
- Is there any way i can debug network requests ??
- Michael Quad
- a peice of art, that's it
- Michael Quad
- a peice of art, that's it
- Андрій Кукуруза
- Very useful!
- Андрій Кукуруза
- Very useful!
- Sebastien Lapratte
- Very usefull! Thanks for you great work!
- Sebastien Lapratte
- Very usefull! Thanks for you great work!
- aaliyah
- Very useful extension!
- aaliyah
- Very useful extension!
- Owen Luke
- Great job!
- Owen Luke
- Great job!
- Suneil Nyamathi
- I keep getting notifications from this plugin even though I've opted out in the settings.
- Suneil Nyamathi
- I keep getting notifications from this plugin even though I've opted out in the settings.
- John Magdy (Zorono)
- Good one but it makes me crazy when it duplicated that `Node.JS DevTools` Tab more than 40 times in minute... please do something in that :( and please can anyone explain why do it need `Viewing my Email Address` Permission ??? (i couldn't find any reason for that... on my opinion at least)
- 青山正太郎
- Thank you!
- 青山正太郎
- Thank you!
- Anonymous
- It's just awesome, feeling like at the top of the mountains using it.
- Денис Авілов
- Such a useful extension which gets you rid of annoying routine actions each time you run a nodejs script.
- Денис Авілов
- Such a useful extension which gets you rid of annoying routine actions each time you run a nodejs script.
- Bruce
- Great job! I'm using nodemon. The problem I'm having is that the UUID in inspector's URL changes on every restart. This plugin solves this problem perfectly.
- Bruce
- Great job! I'm using nodemon. The problem I'm having is that the UUID in inspector's URL changes on every restart. This plugin solves this problem perfectly.
- Hector Bas
- I just got to say, such a simple add-on that is gonna resolve SOOO many headaches. Luckily for me I am at the beginning of the road in setting up a new scripting environment with ClearScript. My whole reasoning for using this engine was 1) we are .NET developers & 2) the support of Google's scripting engine, V8. When it comes to javascript and debugging, Google's dev tools are just unparalleled. Easy to use AND we don't have to use a custom debugging tool for that one off project. Naturally, as I am investigating this new tool, I came across the ability to attach CDT as a debugger, but the process to get it attached was slightly tedious. One of the first solutions I cam across was this chrome extension. Initially I ignored it, since it was clearly advertised for Node.js. However I wanted to see what kind of options could be specified, and man was it easy to configure it for my use case. The only "special" thing I really had to do was change the DevTools url/version in options to point to: "chrome-devtools://devtools/bundled/inspector.html". Afterwards, it worked flawlessly. A few things I would recommend to the extension developer: 1) I'd highly recommend stating somewhere clearly in the description for support of other such tools such as ClearScript, I almost skipped out on this gold mine 2) Potential support for specifying multiple host and port profiles with a naming scheme and active Boolean flag? 3) An option to auto-launch the debugger for an X amount of time from the point of enabling OR if now launch after X time then auto-disable untill manually re-enabled. This would be to prevent unintended attachments (scenario for multiple developers who work on the same set of remote servers) and just have a smooth debugging experience for the time allotted. Perhaps change the color of the logo in the quick launch bar to indicate that it is not actively monitoring. 4) Would it be possible for you to tell CDT to automatically pause execution upon load? If not, not a huge big deal as it seems most of these engines have flags for this type of scenario to make sure that you don't miss any script execution. Overall, fantastic job!
- Anonymous
- Although the automatically opening of the devtools is very usefull i think it's very annoying that it opens in a window with tabs instead of a headless window like devtools usually has, i'm on chrome 70 if that may have anything to do with it
- Gregg Tavares
- There is no defensible reason to have to provide an email address. node does not require an email address, chrome does not require an email address, clang does not require an email address.
- Gregg Tavares
- There is no defensible reason to have to provide an email address. node does not require an email address, chrome does not require an email address, clang does not require an email address.
- Fernando Catacora
- Man, this tool is super useful, thanks!!
- Fernando Catacora
- Man, this tool is super useful, thanks!!
- Fatih Kaya
- Thank you for this awesome extension. It helped me a lot.
- Fatih Kaya
- Thank you for this awesome extension. It helped me a lot.
- 林乐扬
- If could auto connect muti node instance would be better. Now the network tab has no cascade folder structure.
- 林乐扬
- If could auto connect muti node instance would be better. Now the network tab has no cascade folder structure.
- Giovanni Viola
- Great! Easy and powerful debug
- Giovanni Viola
- Great! Easy and powerful debug
- Joshua Newton
- OMG. Where has this been my entire life. Literally closing the devtools tab over and over to watch it magically re-open. No more manually copying debug urls out of my docker logs!!!!
- Joshua Newton
- OMG. Where has this been my entire life. Literally closing the devtools tab over and over to watch it magically re-open. No more manually copying debug urls out of my docker logs!!!!