
Node Debugger
Extension Delisted
This extension is no longer available in the official store. Delisted on 2025-09-15.
Extension Actions
- Minor Policy Violation
- Removed Long Ago
- No Privacy Policy
Debug Node in Chrome devtools
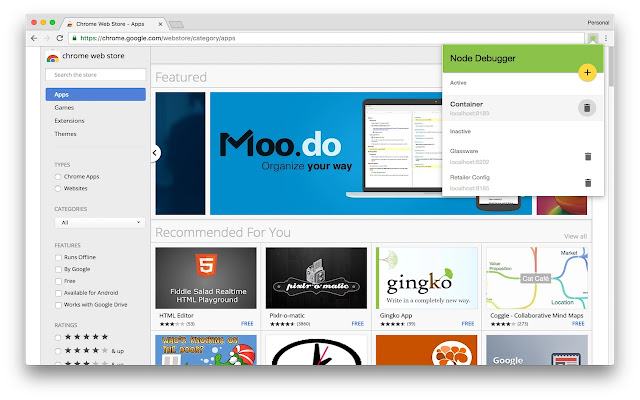
Connect to v8 inspector debugging instances! This extension allows you to save configured debugging sessions and will automatically check them for availability on startup.
To quickly get started you can do the following:
- Start a node 6.3+ process with the --inspect flag set (this will start a debugging session at localhost:9229)
- Click on the extension icon in Chrome and see that the Default session is available.
- Click on the Default session and a new Chrome window will load with the devtools connected to node.
- Carry on making great apps!
Roadmap ahead:
- Attempt to detect when the debugger goes offline (this happens frequently in development with Nodemon) and attempt to reconnect automatically
Latest reviews
- Gilmar Lima
- Simple and very good!
- Tony Ko
- The only one that really works, with a nice interface as well.