
Blackboard Grade Grapher
Extension Delisted
This extension is no longer available in the official store. Delisted on 2025-09-16.
Extension Actions
CRX ID
phbjhhnngmfapkngpoadblamaddefdep
Status
- Minor Policy Violation
- Removed Long Ago
- No Privacy Policy
Description from extension meta
Get a graph of your results in the 'My Grades' secton. (TCD BLACKBOARD ONLY)
Image from store
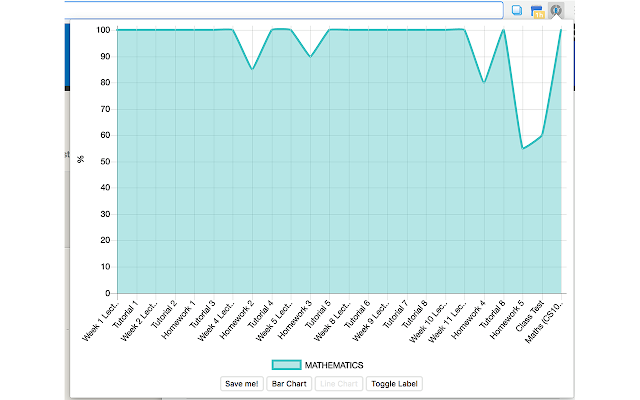
Description from store
This extension gives a graphical representation of your results throughout a module in the form of either a line graph or a bar chart.
Results are ordered to track your progression throughout a module.
Graphs can be saved directly in .png format for record keeping.
If you are not currently on the Blackboard website it will redirect you to it with a single click.
*** ADDED ***
Overall percentage
(TCD BLACKBOARD ONLY)
This extension is unaffiliated with the Trinity College University system or Blackboard.
Latest reviews
- Uzair Qureshi
- Nice bar chart animations