
React Developer Tools
Extension Actions
- Extension status: Featured
- Live on Store
Adds React debugging tools to the Chrome Developer Tools. Created from revision 3cde211b0c on 10/20/2025.
React Developer Tools is a Chrome DevTools extension for the open-source React JavaScript library. It allows you to inspect the React component hierarchies in the Chrome Developer Tools.
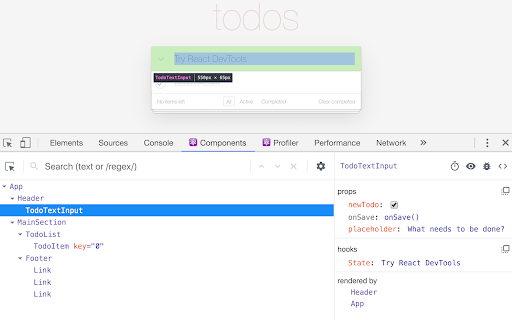
You will get two new tabs in your Chrome DevTools: "Components ⚛" and "Profiler ⚛".
The Components tab shows you the root React components that were rendered on the page, as well as the subcomponents that they ended up rendering.
By selecting one of the components in the tree, you can inspect and edit its current props and state in the panel on the right. In the breadcrumbs you can inspect the selected component, the component that created it, the component that created that one, and so on.
If you inspect a React element on the page using the regular Elements tab, then switch over to the React tab, that element will be automatically selected in the React tree.
The Profiler tab allows you to record performance information.
This extension requires permissions to access the page's React tree, but it does not transmit any data remotely. It is fully open source, and you can find its source code at https://github.com/facebook/react/tree/main/packages/react-devtools-extensions.
Latest reviews
- Tuomas Jaakola
- I was developing a web app with Next.js 16.1.6 and noticed that Chrome eats my CPU. Using Chrome's Task Manager (Shift+Esc), I noticed that the React Developer Tools extension was the culprit. I disabled the extension and CPU thanked me.
- Chris Francis
- Unusable due to poor performance. Thrashes the CPU and crashes the browser when trying to record a ~5s profile, even on an M2 Pro macbook. I've not been able to use this extension on any non-trivial React app, in fact I've had to disable it entirely to prevent it randomly locking up the whole Chrome devtools window even when not in use. Really hope this tool gets some love (and a complete rewrite for performance)!
- Przemysław Ziomek
- continously stuck while using in chrome, need to reinstall every time
- Jay S.
- Features for this have stagnated–Vue's dev tooling ecosystem beats the pants off of React, which is a shame. Component trees still have the same UX issues they had years ago and there's still nothing super solid for debugging contexts and hooks.
- Ian Dunning
- Perfectly supresses the annoying "Download the React DevTools for a better development experience" in the console log. 5 stars A++.
- Meir
- great
- Alexandr Ivanov
- Chrome version 143.0.7499.110 is not working. Everything was fine before the update.
- Apoorv Darshan
- best
- Volodya Hovhannisyan
- Hi there, I would like to see old `rendered by ` section again, because in version 7.0.1 loading that trace takes too long. Review please optimization of the new version.
- Petar Kolev
- Well made and useful <3
- Narsi Murji
- 5 STARS
- Ivan
- Started to randomly overload CPU
- Mohammad Reza Karimi
- Sooo limited features (compared to Vue devtools) makes it almost useless
- max ivaneychyk
- This is a great extension, especially when used together with Pixel Perfect Pro – they complement each other well.
- Jim Bolino
- unable to disable the "Download the React DevTools for a better development experience" console.info spam
- Vadim Kuznetsov
- Here we go again...
- Pavan Reddy
- excellent
- Shane Spencer
- This is going to be amazing! Thank you.
- Martin Garcia Lopez
- great and excellent
- Andrei Zanouski
- good tool
- Mohammad Javad Rezaei
- Amazing Tool for Developers.
- Саша
- When next-intl is enabled and an incorrect translation key is used, it triggers an infinite loop of errors, such as: IntlError: MISSING_MESSAGE: Could not resolve 'title 123' in messages for locale 'en'. React Strict Mode disabled In a regular browser session, the console gets flooded with these errors, while in incognito mode, only two messages appear
- Thaís Carvalho
- What’s the deal with this required "copy and paste" permission? It states that the extension can modify any data I copy and paste. Am I missing something about why this is necessary to keep the extension enabled? Bizarre. Edit: I found more context about this in their repository if anyone is interested: https://github.com/facebook/react/pull/32077 https://github.com/facebook/react/issues/32244 https://github.com/facebook/react/pull/32262
- Jon Simão (J0N)
- The copy & paste access is really a madness, think about it: If you have a crypto wallet address copy and then you go to make a transfer on an exchange, they can change that wallet address to another and then you cry.. This can apply for bank transfers and every money transactions. They're crazy release something like that.
- J-Dawg
- Tool just started requesting copy & paste access. Anyone have an idea why it'd need this? I'm disabling for now.
- Антон Омеляненко
- The profiler stops working after the first launch. I tried it on different computers with just vite and react
- Faisal H.
- amazing tool
- Zalman Shlisel
- Disappears from DevTools after first search!
- Oleg Gribanov
- cool
- Jordan Hoffman
- Very glitchy. I'll record one thing on the profiler, and then it will hang. I close it and try to reopen and the profiler no longer appears as an option in chrome dev tools.
- Danny Kirschner
- Much useful, so impress me
- OBI EMMANUEL
- tool no longer showing in dev tools
- Om Prakash
- use show highlights in settings, so it'll work
- Ryan Dick
- The developer tools aren't showing up with Chromes new update
- Aanchal Priya
- Many times it gets disappear and I really struggle very hard to get it back. Please do something to fix this..
- Grace Yasmine Bohainan Diagone
- I like it, so useful
- Subhajit Sarkar
- there is no components and profiler in my tab
- abdallah
- i will try it now i hope it useful for debuging
- Khushi Agrawal
- its not working
- Akhilesh Sagar
- this tool is very useful
- Erik Moore
- Fine.
- 8E 10 Md Al Amin
- This tool is very helpful to me as a beginner web developer and i enjoy to work with it.it's great.
- Hatsey Tikur
- a nice tool. it makes debugging easy.
- Victor Bitencourt
- If it doesn't work: don't forget to close and reopen your browser!
- M Masanam
- very very useful tool
- Try Hellojs
- it's good but i am facing a problem when i am using React.memo(...) the component which are not re-rendering also showing highlight why ?
- Ousainou BS Jammeh
- Worked :)
- Pritimay Panda
- Good One
- david mitchell
- For those saying the tabs aren't appearing, you have to tinker with it a bit. I closed the inspect window and reopened it. After that, the tabs popped up for me.
- Keyona Parker
- no components tab :/