
AJAX Debugger
Malware Detected
This extension has been flagged as potentially malicious.
Extension Delisted
This extension is no longer available in the official store. Delisted on 2025-09-16.
Extension Actions
- Minor Policy Violation
- Removed Long Ago
- No Privacy Policy
Logs all AJAX activity to the Dev Tools Console, allowing inspection of AJAX calls, and open calls in new tab with all the inputs.
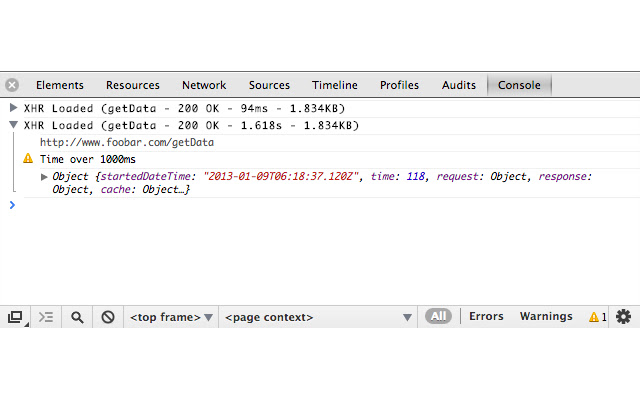
AJAX Debugger will log all AJAX (XMLHttpRequest) activity to Chrome's Developer Tools Console. This allows developers to easily see top-level request info, like the HTTP status, response time, and size. Click the URL to open the AJAX call in a new tab, including all the inputs, making debugging much easier. You can even drill down to see all the low-level request details including the HTTP header information.
Logged data includes:
• File called
• Response Status
• Response Time
• Response Size
• AJAX source link with all input params
• Object containing all request and response details
• Response content (optional)
• Warning if response takes longer than set time
Logo & promo design by Andy Merskin <www.AndyMerskin.com>
Latest reviews
- Diego Garcia
- No funciona
- Antony
- don't work now
- Francisco Daniel García Noriega
- Please, add support to show the method (POST, GET, PUT, etc) in the console. It would be useful for a first insight. thanks!
- Иван Чиненков
- dont work.
- d0gkiller87
- Good idea unfortunately not working now.
- 刘晶
- Not working at all
- Ana M. E.
- A mí tmp xD
- Iman Mahmoudinasab
- limit length of time two digit not 358.31599999801256ms. it would be great if we could have option to show only Response object.
- nhan tam
- Nice. I try to debug ajax params and It's working well Thank you so much Regards
- Max Schmidt
- Funktioniert nicht.
- Ahmad Awais
- Awesome!
- matt
- thanks!
- soluciones uno
- no funciona. no aparece nada en la consola.
- Yanislav Tankov
- Usefull!
- Prioritybutton, Lda
- PERFECT! Thnx a lot!
- Karthikayini C
- thanks for this extension
- Филипп Василевский
- Мне всё нравится )
- Roma Rush
- не работает и ничего не выводит
- Samarak Klangtap
- It's Well
- Eduardo Paixão
- Não funfa
- c01nd01r
- Good tool, by need checkbox for on/off this function!
- 风爻
- no work on mac os 10.11,so sad.
- xeb edy
- Excellent amount of detail, very usefull. Thanks!
- Jeffrey Riaboy
- Works well enough, and I couldn't find anything else out there like it. NOTE: I've modified the source and done a pull request on github to fix the problems I am mentioning below, so I am also changing it to 5 stars :-) OLD REVIEW: It is a bit cumbersome to click through 4-5 objects to get through to the actual request data, and the response data isn't handled very well on the console display with JSONP
- 韩建东
- 十分实用
- Junaid Atari
- The best one
- uday
- Very helpful & awesome tool! :)
- Rene Padillo
- Nice! but lacks a few functionality that I'm looking for.
- Kostya Lesnichenko
- Very useful extension for debugging! Sometimes "Content-Type: application/json" missing in AJAX response. That's why Chrome doesn't show response body in Network tab of Dev Tools (after INSTANT page reload). BUT when AJAX Debugger installed and "Include Response Content in [Object]" enabled, Chrome starts showing response body! Very handy!
- Rolando Kaizer
- Show response is not displaying the response very well. It is cut, not like Firebug which really display all the response completely so that we can read if there is any error message generated by server. But it is really a great extension, and the only one in Chrome Store.